
An 2015 update of SLR performance assessment. The methodology was reported at the 17th International Workshop on Laser Ranging (Slide PDF) in 2011.
We have worked up some interesting statistics about the ratio of successful ranging observations with respect to all possible observations (> 20 degrees of elevation). Let us call it “hit rate” here – this is somehow similar to a batting average of a baseball (not a cricket) player. In other words, it is equal to the probability that a satellite flying over a station is laser-ranged from the station. Sky conditions are not taken into account.
The most productive 20 stations (ILRS Global Performance 2015 4Q) in 2015 are tested here. We show the results for four satellite groups: (1) “ETALON-1 and -2”, (2) “LAGEOS-1 and -2”, (3) “LARES”, (4) “STARLETTE and STELLA”. Fig. 1 shows the pass-based hit rate and the NP-based hit rate.
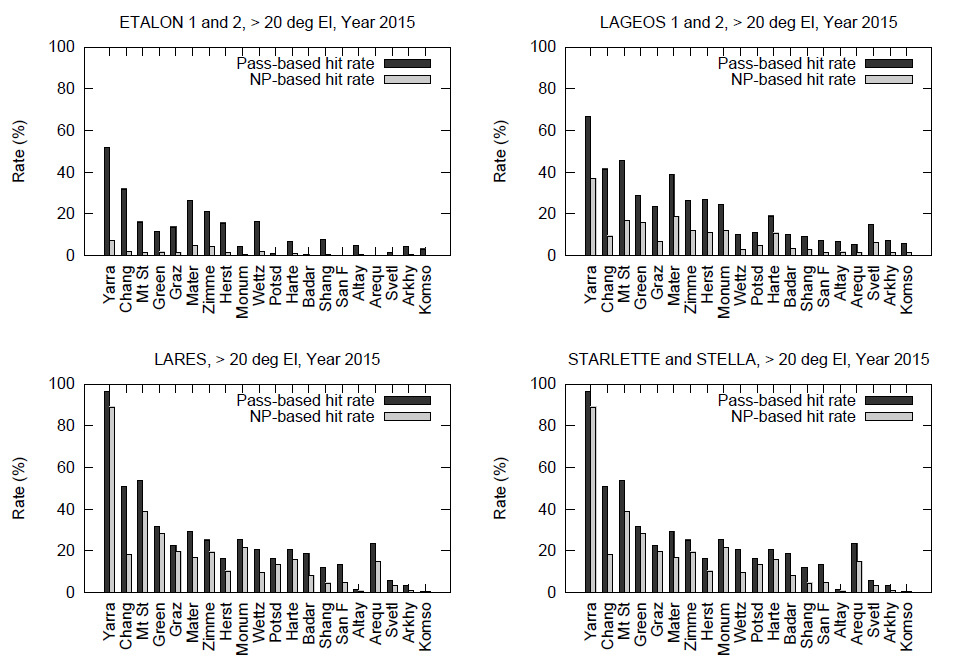
Fig 1 (click to enlarge). Pass-based hit rate and Normal-point(NP)-based hit rate.
As we see the ratio between the pass-based hit rate (black) and the NP-based hit rate (grey) differs by stations, the average number of NPs per pass is now plotted in Fig. 2. Note that this is the average among observed passes.

Fig. 2 (click to enlarge). Average number of normal points per pass.
It is recommended to track a wide coverage from horizon to horizon, even if it is sometimes interrupted. The average duration of a pass is therefore plotted in Fig. 3.
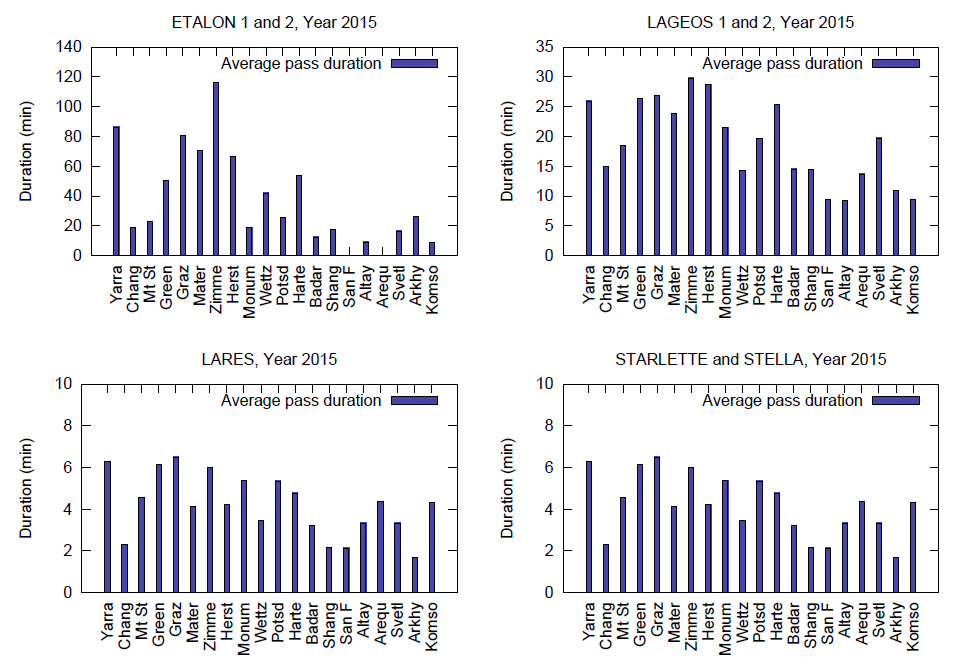
Fig. 3 (click to enlarge). Average pass duration, defined as the time between the 1st and the last NP